Through IDA+VMWare for debugging any kernel function
Introduction:
A most of time we used Windbg+VMWare for kernel debugging. But there is a problem that we cannot use it for debugging a Interrupt Service Routine (ISR). In such case system will be hang and occur a infinite loop within a interruption. Such as INT 3 breakpoint interruption. This is because the interrupt cannot be handled normally, the breakpoint exception is never been dispatched normally.
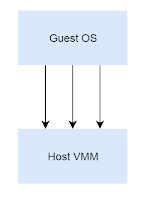
Because of this reason, we actually can able to use a VMWare’debugging interfaces for debugging ISR. VMWare exported a interfaces with GDB, we can enable it through this
configuration in .vmx file

For 64-Bit system should debugStub.listen.guest64 = "TRUE"

For x64 system we can connect to localhost: 8864 , the port of 32bit system is 8832

Select process ID is 0


Although we are attached into kernel, but we may not able to view the code since the memory region is not created, we can use IDA function - debugger->manual memory regions

Right click -> Insert

Set as following , we cannot set the end address to 0xFFFFFFFFFFFFFFFF.

Run the system

Now, IDA will pop this dialog to notify us, the system is running, and we can suspend the VMWare at any given time. (Assuming VMWare is freeze without any BSOD, we also can suspend the system, it will be stopped at the RIP that Guest is executing.

Use Case :
- In case we need to debugging with INT 3 ISR.
1. We can use Windbg for normal kernel debugging first, and getting a INT 3 ISR address by executing command !idt, But we DO NOT set a breakpoint through Windbg becoz system will be hanged
2. Then we locate the RIP in IDA and set a breakpoint on that ISR.
Use !Idt command looking for INT 3 ISR.

Attach to the Guest kernel through IDA, and Press suspend to stop the system.
And locate the Address of INT 3 ISR, We only can see the binary not an assembly code.


At that time, we can use ‘c’ hotkey to disassembly the function, and now we can set a breakpoint by ‘F2’ hotkey, then run the system.

At the any given time, we set a breakpoint , such as break by windbg as following

IDA will be capture the interruption, since it is emulating the Guest RIP, it has full control of the virtual hardware. Indeed, for now, IDA is similar to hardware debugger now.


These type of trick can be used for kernel debugging, and VT-x debugging.

Comments
Post a Comment